
I was doing research on how much money Americans spent on Alcohol? Why I do this research? Because I like asking some weird questions myself then keep searching on the Internet and learn more random things. That is kinda my hobby:)
Anyway, It looks like $565 per year. Pretty much 1% of their Gross Income.
Then, I want to check out what is “Alcohol Tracker” keyword’s search score on iOS in the USA. To try to figure out is there any data it can tell us people want to stop drinking or not?
According to MobileAction* Keyword Trends (aka Google Trends for Mobile) Data, the “Alcohol Tracker” keyword’s average search score is 30 out of 100. That is about a good search volume keyword. Decent amounts of people are searching for it.
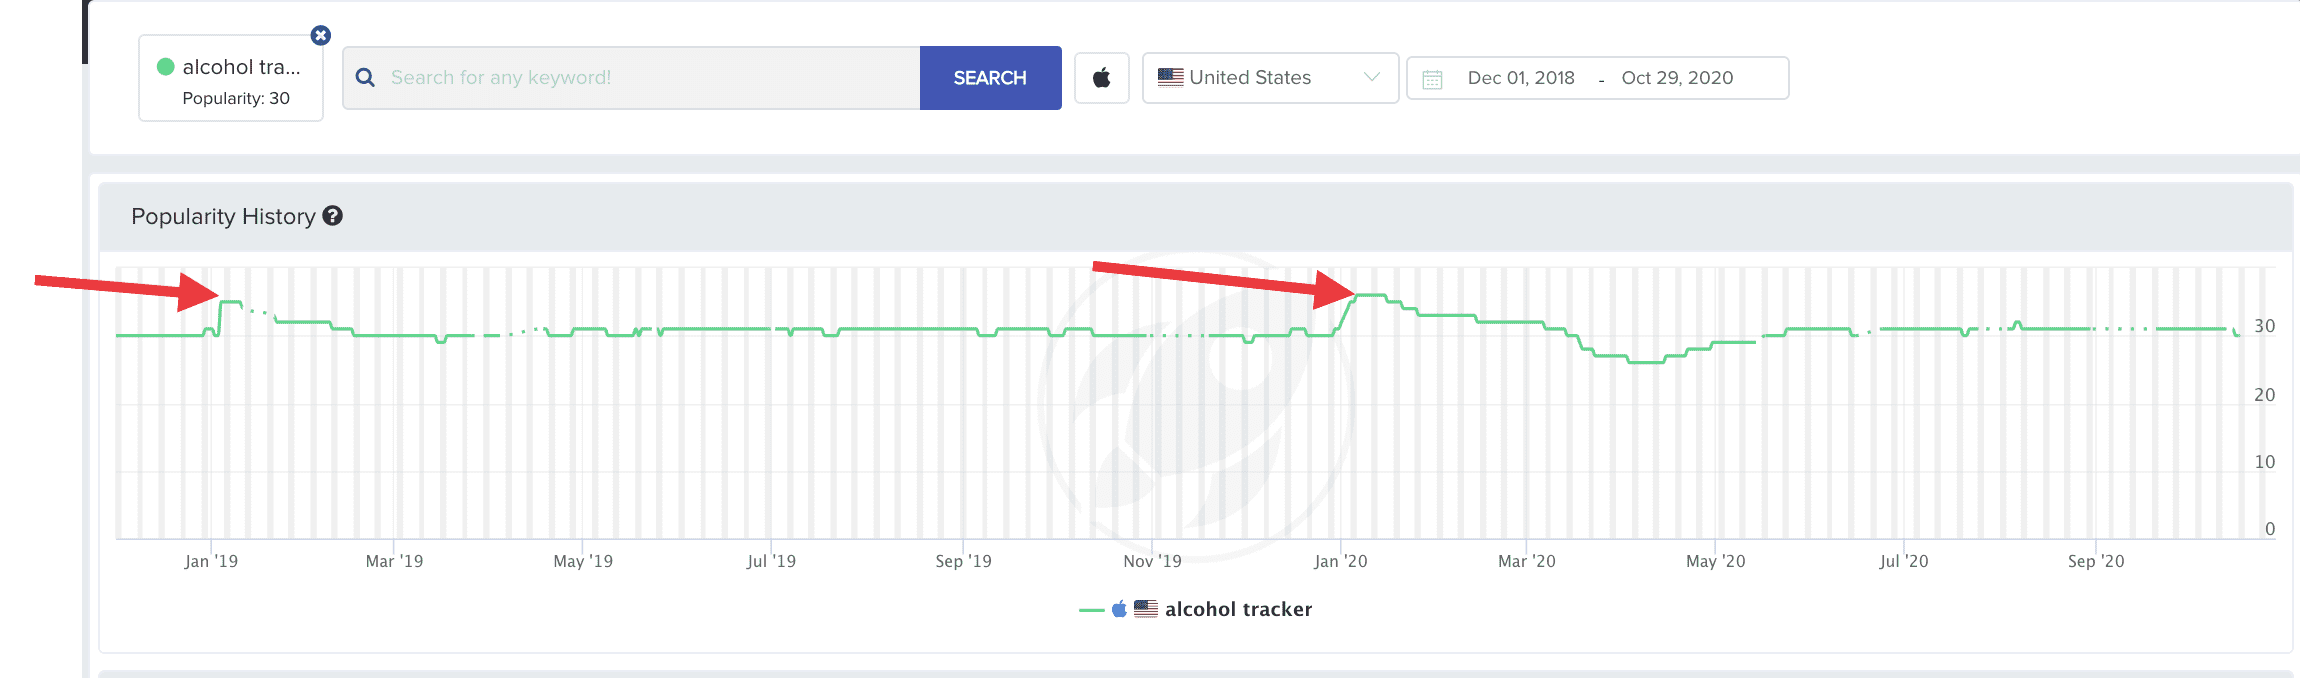
If you look at the data between 12/1/18-10/29/2020, You can see 2 peak times of searching the “Alcohol Tracker” keyword. Guess which days are those?
Yes, you are right, right after the New Years’ party. In the first week of January of 2019 and 2020 search score of the “Alcohol Tracker” jumped from 30 to 35. Pretty much, these days everyone making their new year resolutions. Then track their progress and looks like quit after a couple of weeks:) However, 2020 looks different than in 2019.
I saw a big drop (April 2020), Why? Then I did a little bit of research. Yes, I heard from the news people are drinking more alcohol. But Is that really true?
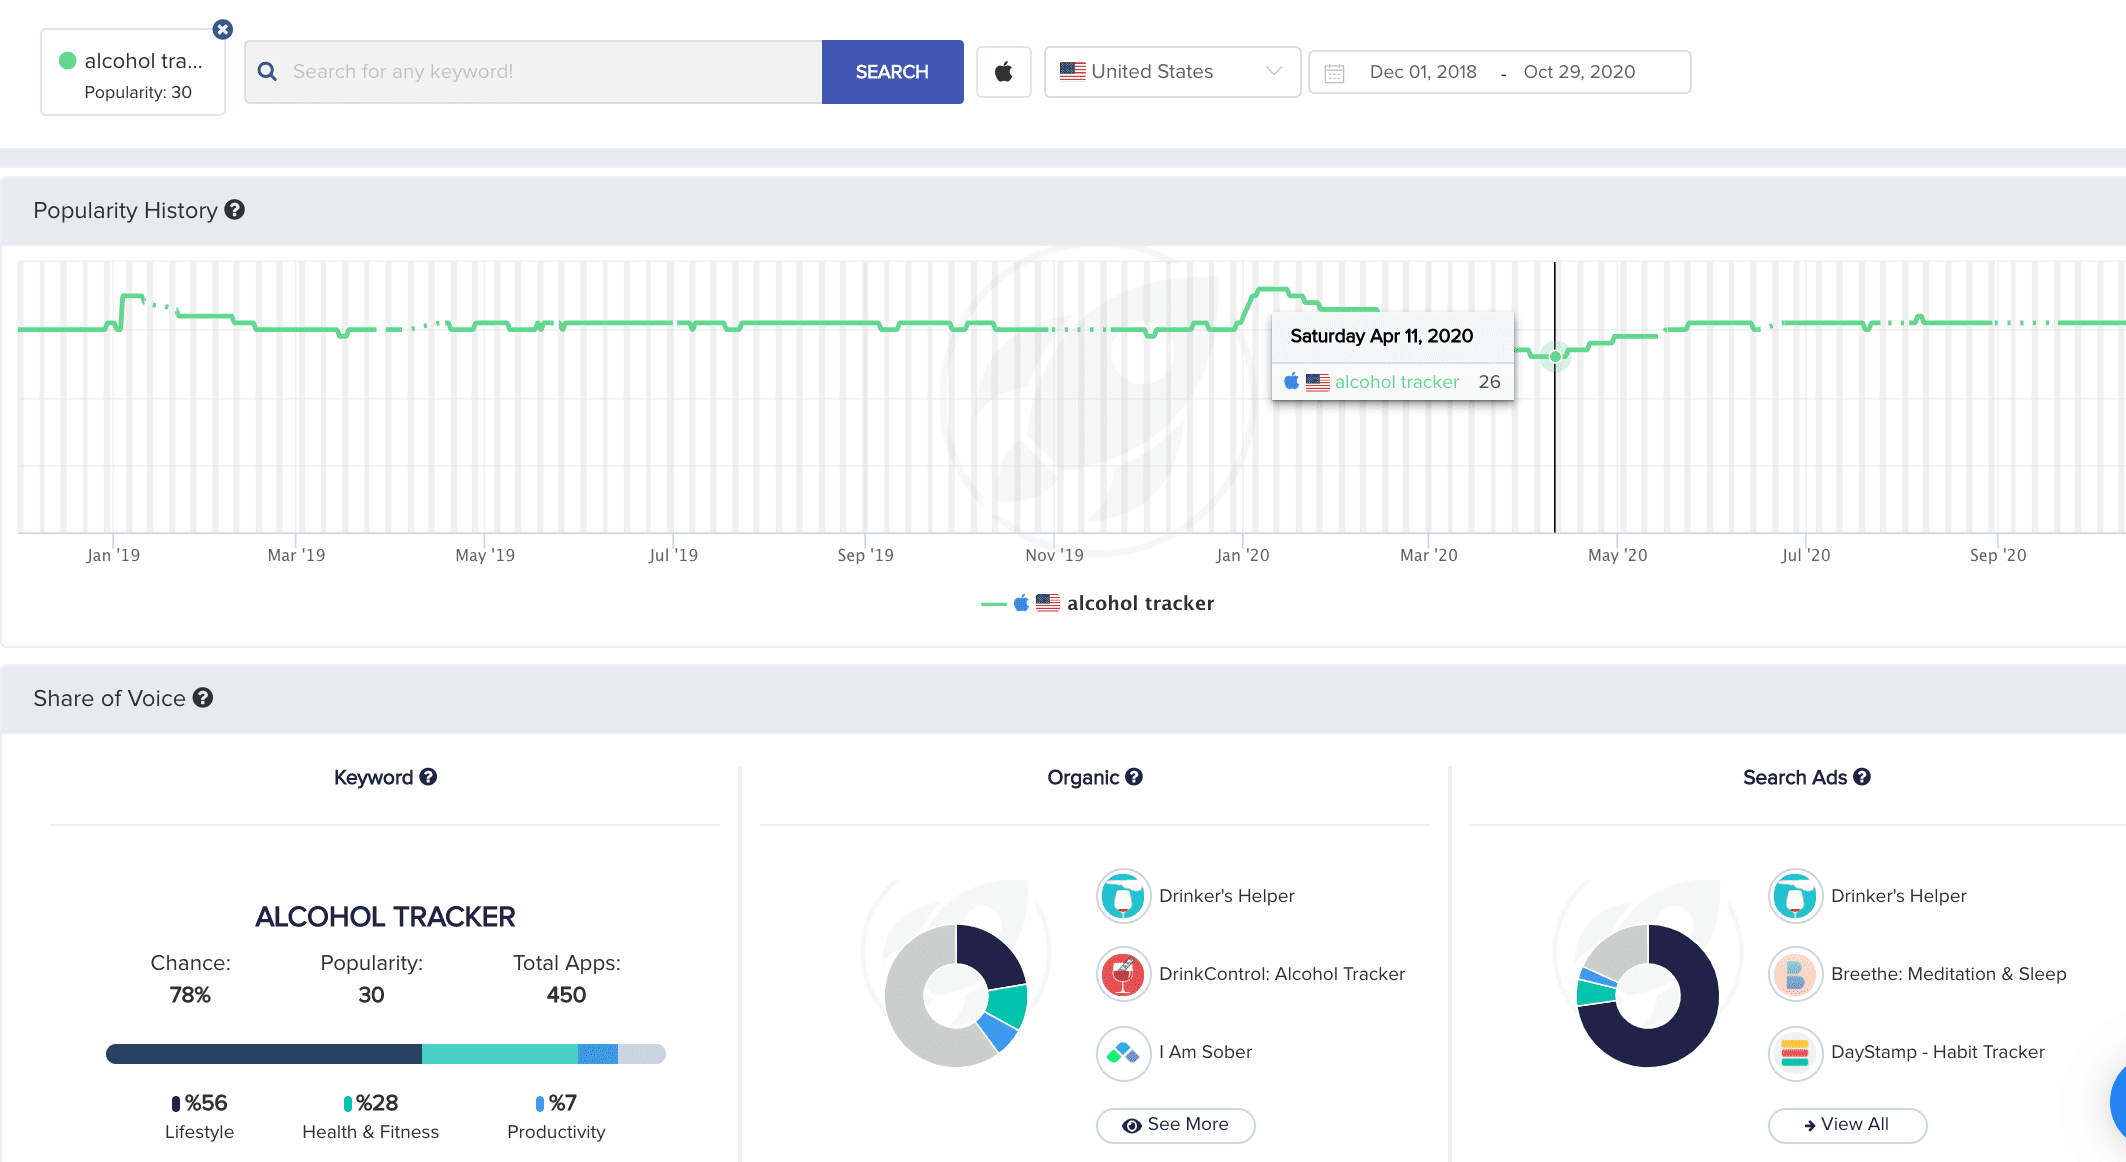
During COVID-19 first wave of shock, “According to a Morning Consult poll of 2,200 U.S. adults conducted in early April, 16% of all adults said they were drinking more during the pandemic, with higher rates among younger adults
It looks like April 11 is the lowest search volume (26) of the “Alcohol Tracker” keyword. That means people are drinking more than usual regular April. If we compare April 2020 and April 2019, Last year pretty much a very flat year for “Alcohol Tracker”
It was a good exercise for me. I learned a couple more interesting things about user behaviors on the App Store and overall consumer behavior. I’ll probably extend this research for other countries and try to understand Is there any repeating pattern or not?